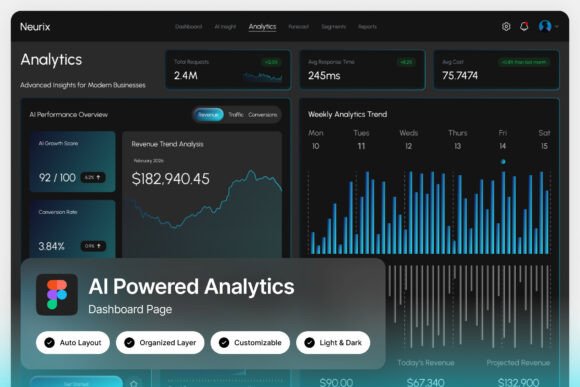
Neurix AI Powered Analytics Dashboard
Every data-driven project deserves an interface that feels as intelligent as the insights it presents. The Neurix AI Powered Analytics Dashboard UI Kit offers exactly that—a visually compelling, dark-themed canvas designed to transform complex data into clear, actionable stories. It's built for professionals who understand that powerful analytics need equally powerful presentation.
This isn't just another admin template. Neurix delivers a sophisticated environment featuring waveform-style data charts, real-time metric cards, and a high-contrast interface that makes information pop. The bold typographic hierarchy and strategic use of neon accent colors aren't merely stylistic choices; they are functional elements that guide the user's eye, reduce cognitive load, and enhance data comprehension. For designers and developers crafting AI-powered analytics platforms or business intelligence tools, this dashboard provides a robust and visually striking foundation.
Designed for Clarity and Impact
The core strength of the Neurix dashboard lies in its thoughtful design system. The layout is pixel-perfect, ensuring every element aligns with precision. Layers are well-organized, named, and grouped, making customization in Figma intuitive and efficient. This level of organization saves valuable time during the design and development process, allowing you to focus on tailoring the interface to your specific data sets and user needs rather than wrestling with file structure.
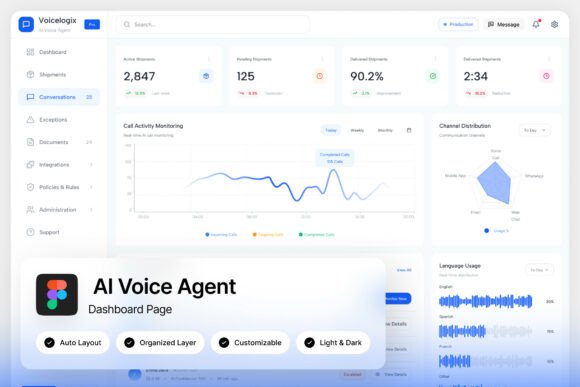
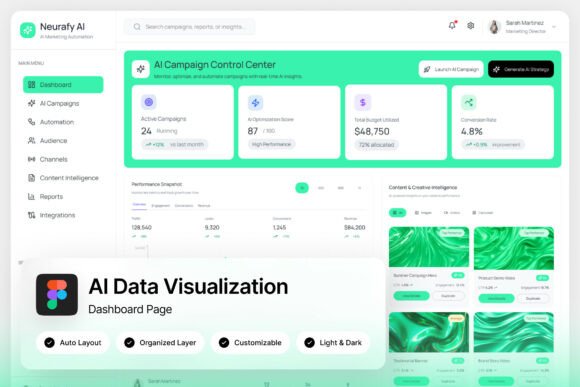
With a resolution of 1440×1024 pixels, the two included high-quality screen designs provide a clear vision for both desktop and large-screen applications. The inclusion of both light and dark mode interfaces offers flexibility, allowing you to match the dashboard's aesthetic to your brand identity or the end-user's environment preference. This adaptability is crucial for creating a professional and user-centric experience.
Practical Applications and Creative Value
While engineered for analytics, the design principles within Neurix have broader creative value. The modern, tech-forward aesthetic can inspire projects beyond traditional dashboards. Consider how its visual language—clean lines, dynamic charts, and controlled neon accents—could influence:
- Pitch Decks and Investor Presentations: Use the dashboard's style to create slides that visualize market data, growth metrics, and performance KPIs with immediate clarity and impact.
- Tech Startup Branding: The color palette and typographic approach can inform a brand's visual identity, especially for companies in SaaS, fintech, or AI sectors that want to appear innovative and data-competent.
- Interactive Prototypes: The Figma file serves as an excellent starting point for building interactive prototypes, allowing you to test user flows and data interactions with a realistic, polished interface.
For data scientists and business intelligence designers, it's a tool that bridges the gap between raw data and stakeholder understanding. For UI/UX designers, it's a masterclass in creating a cohesive, high-contrast design system that prioritizes usability without sacrificing modern style.
Integrating into Your Design Workflow
When incorporating a design asset like the Neurix dashboard into your workflow, a few practical steps ensure a smooth process. First, review the provided help guide to understand the file's structure and any specific design decisions. Next, leverage the free Google Fonts included to maintain typographic consistency across your project. The well-organized layers mean you can easily swap out placeholder content for your own metrics and data visualizations.
Think about font pairing if you're extending the design. The dashboard's modern sans-serif typography pairs well with clean serif fonts for longer body text or monospaced fonts for code snippets, maintaining a professional and readable hierarchy. Always test your customized designs at the intended resolution to ensure visual fidelity and readability remain intact.
Choosing a design asset is about more than just aesthetics; it's about finding a solution that enhances your project's professionalism and effectiveness. A well-crafted dashboard UI like Neurix does more than display data—it builds trust, communicates competence, and provides a seamless experience for users navigating complex information. It’s an investment in the visual storytelling of your digital product.