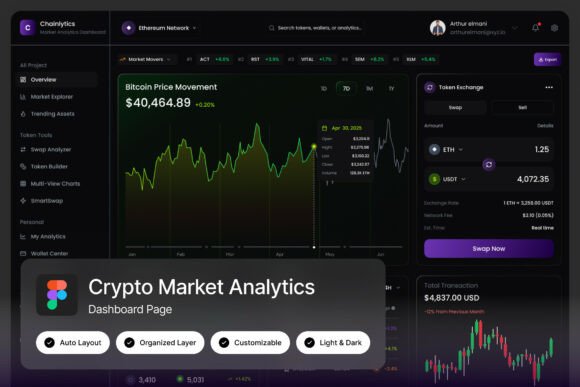
Chainlytics: A Modern Crypto Analytics Dashboard Template
For designers and developers building the next generation of financial technology, the presentation of data is as crucial as the data itself. The Chainlytics Crypto Market Analytics Dash offers a sophisticated, ready-made solution for showcasing complex blockchain and market information with clarity and style. This isn't just a collection of charts; it's a thoughtfully crafted environment designed to make digital asset tracking intuitive and visually compelling.
At its core, this template provides a high-resolution (1440x1024 px) Figma framework featuring two unique screen layouts. The design philosophy is distinctly modern and futuristic, employing clean lines, strategic data visualization, and a layout that guides the user's eye effortlessly through key metrics. Whether you're monitoring DeFi protocols, tracking cryptocurrency portfolios, or building an analytics platform, Chainlytics provides a polished foundation that communicates professionalism and technological sophistication from the first glance.
Practical Applications for Your Projects
The versatility of this dashboard template makes it a valuable asset for a range of creative and commercial projects. Consider these use cases:
- Brand Identity & Web Design: Use the dashboard's aesthetic as a springboard for a cohesive brand identity for a crypto startup, fintech app, or blockchain service. The design language can inform everything from logo concepts to the full website design, ensuring visual consistency.
- UI/UX Prototyping: For product designers, it serves as a fantastic starting point for prototyping user interfaces for market tracking systems or portfolio management tools. The named, well-organized layers in the Figma file make customization straightforward.
- Marketing & Social Media Graphics: The futuristic layouts and data visualization components are perfect for creating impactful social media graphics, presentation slides, or infographic elements that explain complex crypto concepts in an engaging way.
- Digital Product Mockups: Showcase your own application or SaaS product by integrating it into this professional dashboard environment, elevating the perceived quality of your digital assets.
Tips for Effective Use
To get the most out of a design asset like this, a few practical considerations can make all the difference. First, always test the template with your own data and color schemes. The included light and dark mode interfaces offer great flexibility, but ensure your chosen palette maintains readability and aligns with your project's mood. Pay attention to font pairings; the template uses free Google Fonts, but swapping them with a complementary serif or sans-serif typeface can add a unique touch to your brand identity.
Remember, the goal is to use this template as a powerful starting point, not a final product. Customize it to reflect your specific needs—adjust spacing, modify chart types, and integrate your unique branding elements. This process of adaptation is what transforms a great template into a truly distinctive and professional presentation for your blockchain platform or crypto analytics service.
Choosing the right design framework is about more than just aesthetics; it's about trust, clarity, and user experience. A well-executed dashboard like Chainlytics demonstrates a commitment to quality and can significantly enhance how users perceive and interact with your data. For anyone serious about building in the crypto space, having a visually coherent and functionally clear interface is a critical step toward success.